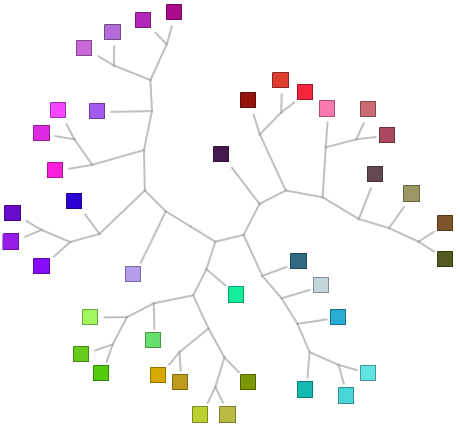
Construct and visualize the hierarchical cluster of arbitrary data using the new function in Version 11.
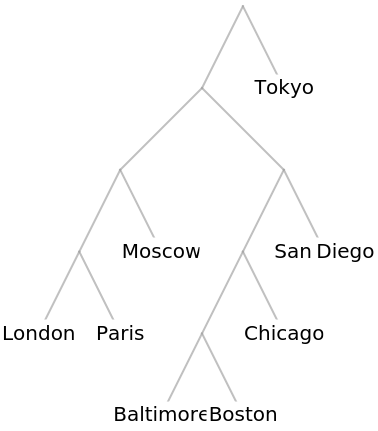
Cluster cities based on the proximity to one another:
In[291]:=
ClusteringTree,,,,,,,
Out[291]=
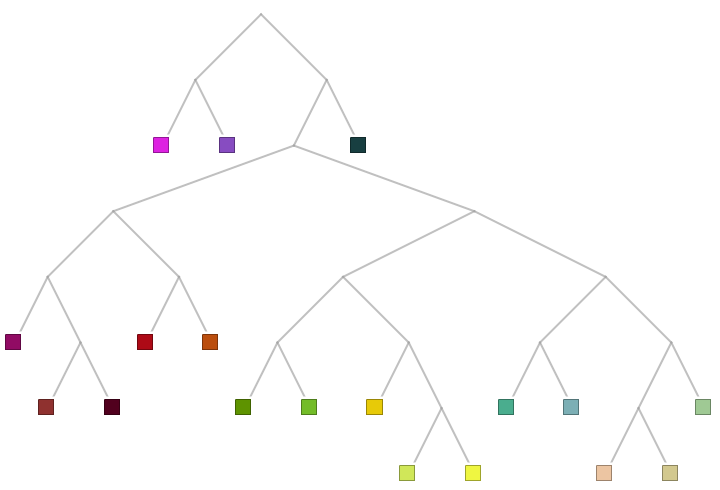
Obtain a cluster hierarchy from a list of colors:
In[151]:=
colors=RandomColor[18]
Out[151]=
,,,,,,,,,,,,,,,,,


In[152]:=
ClusteringTree[colors,ClusterDissimilarityFunction"Centroid"]
Out[152]=
Choose a different :
In[117]:=
ClusteringTree[RandomColor[40],ClusterDissimilarityFunction"Centroid",GraphLayout"RadialDrawing"]
Out[117]=